No repaint
Higher-timeframe levels are confirmed on candle close, so they never move after the fact.
Stop switching between timeframes. Smart Money Map shows the liquidity, imbalances and market structure from up to five timeframes on a single live chart, for every instrument on Tradex Bot, so you can see the full picture without redrawing anything.
Smart Money Map is a charting and technical analysis software tool for educational and research purposes only. It does not provide financial advice, trading signals or investment recommendations.
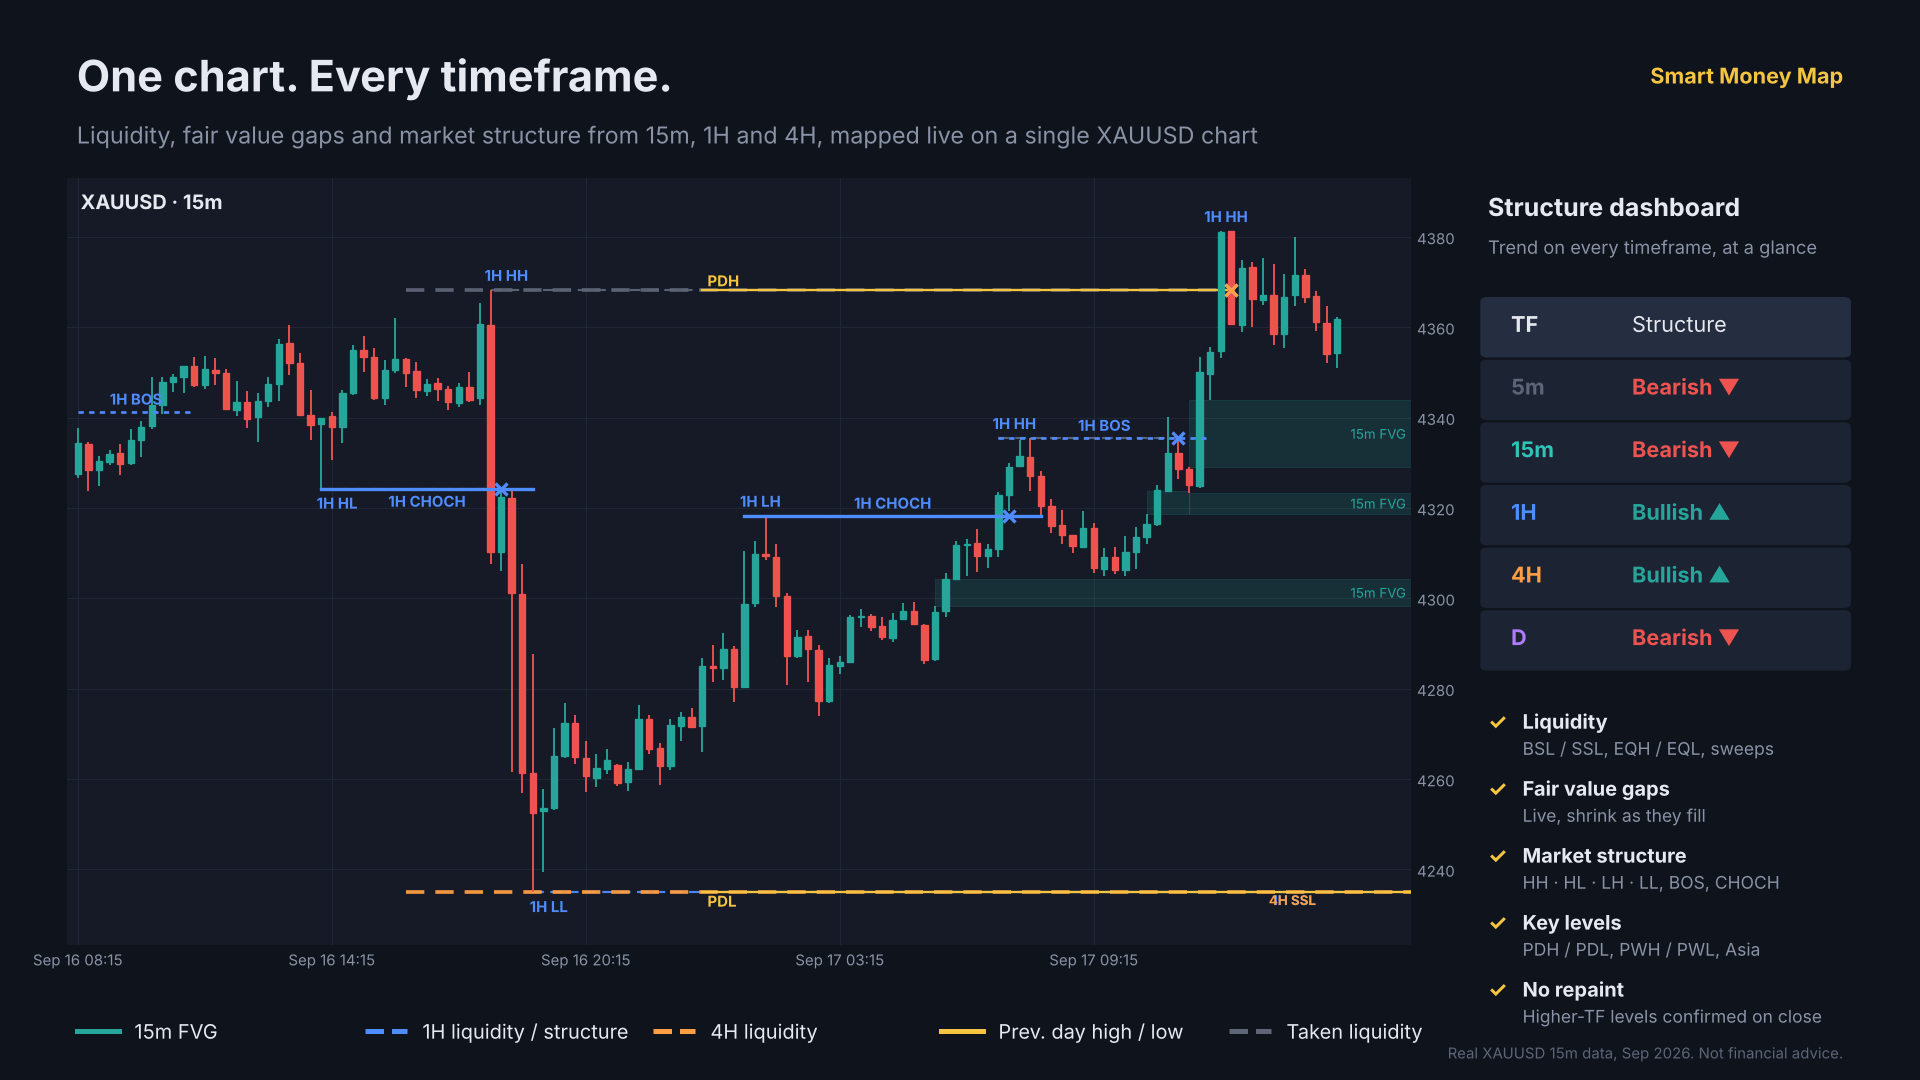
Choose up to five timeframes. Each has its own colour and label, so you always know whether a level comes from the 15m, 1H or 4H. Higher-timeframe levels are drawn thicker and stand out where it counts.
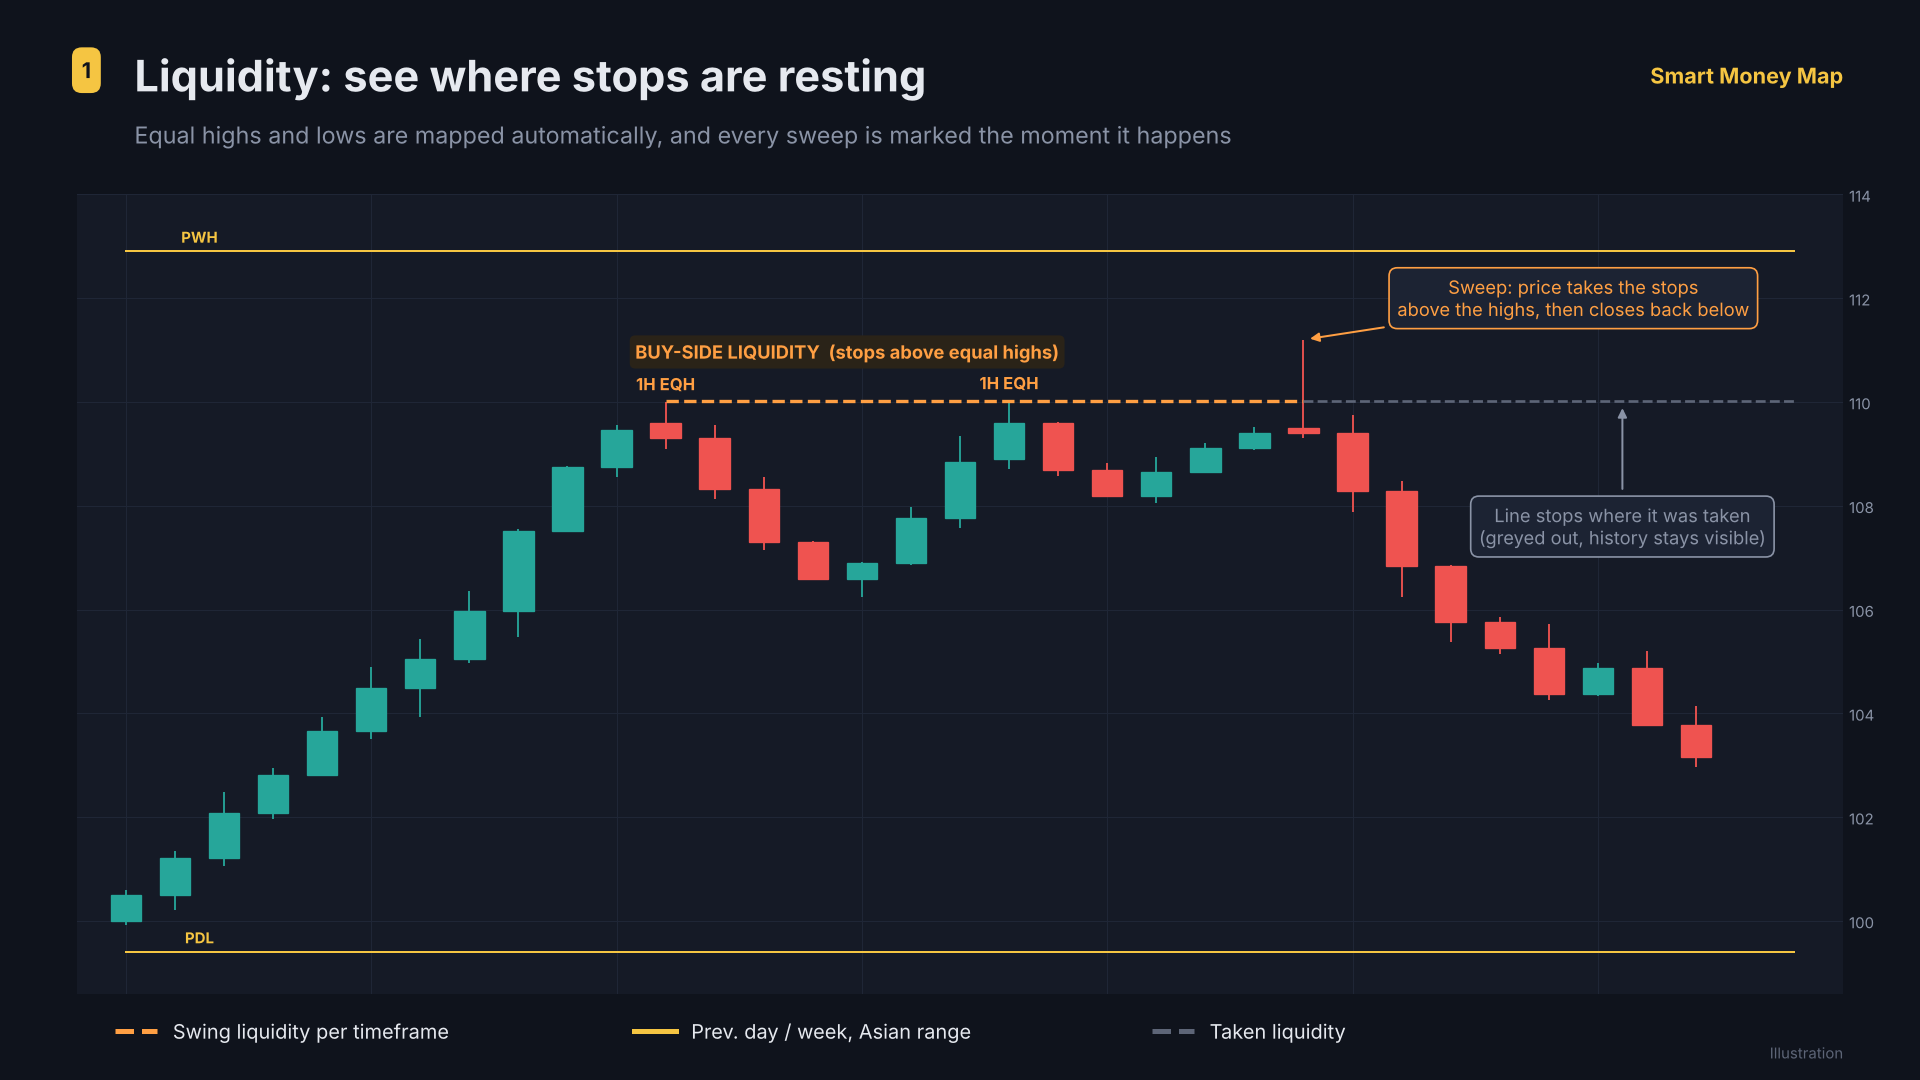
Equal highs and equal lows are where stop orders tend to collect. Smart Money Map finds them for you and marks them as EQH / EQL. When price runs through a level and takes that liquidity, the line stops at that candle and turns grey, so every sweep stays visible on your chart.
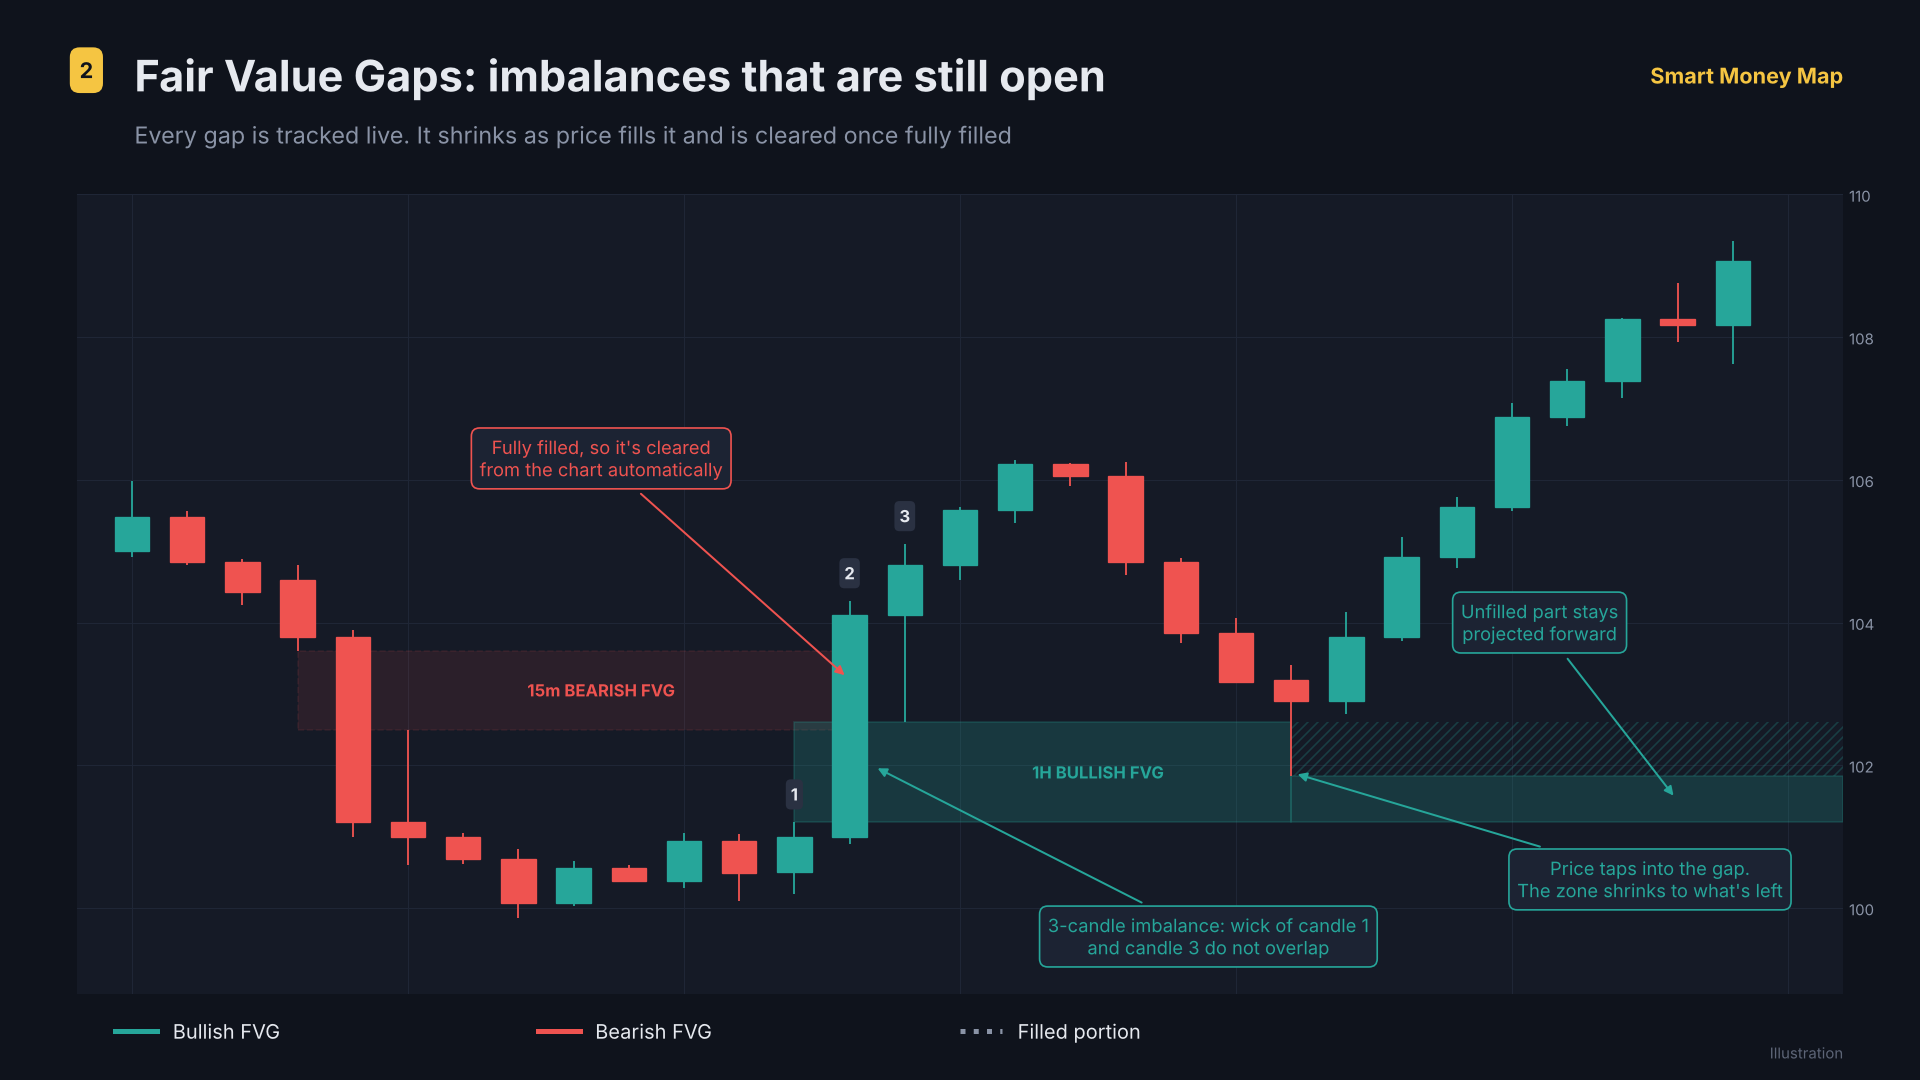
A fair value gap forms when price moves so fast that the wicks of the first and third candles don't overlap. When price trades back into a gap, the zone shrinks to show only the part still open. Once it's completely filled, it's cleared from the chart.
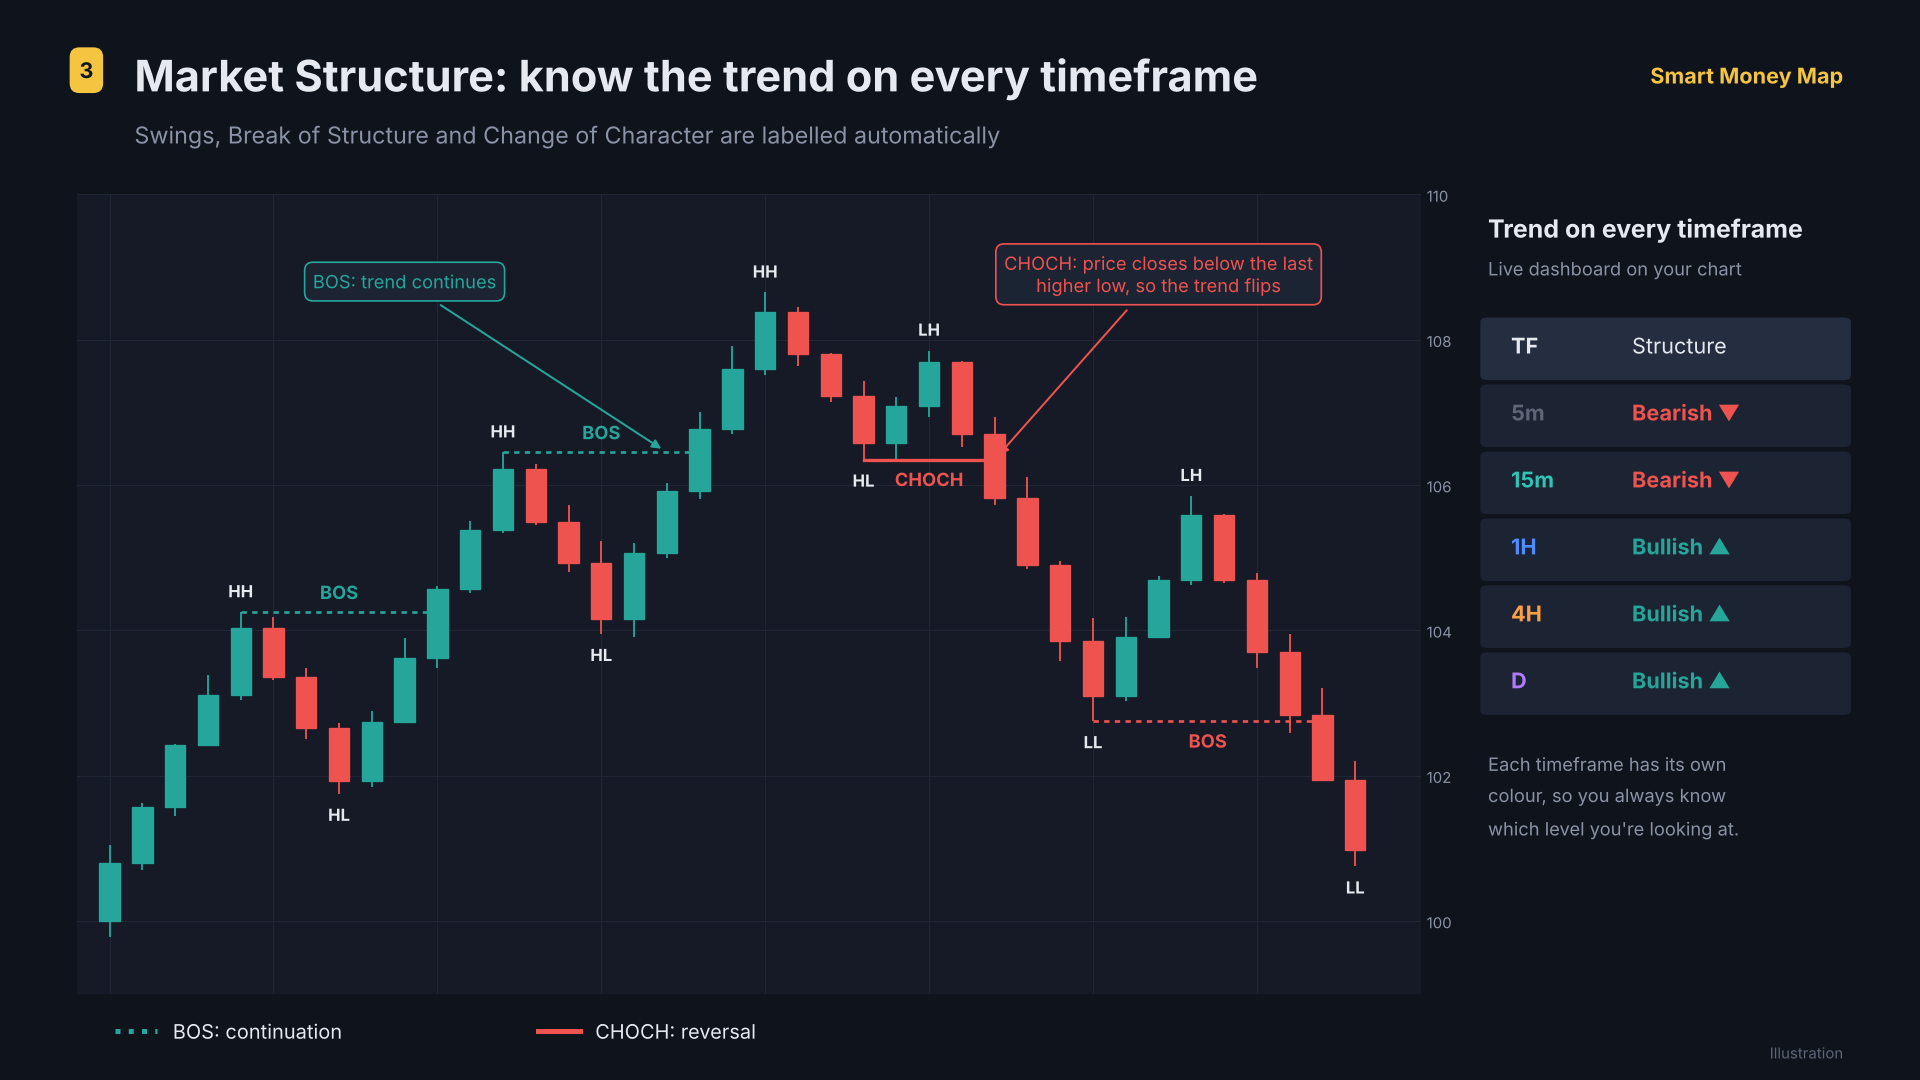
Swing points are labelled automatically as HH, HL, LH and LL. A Break of Structure (BOS, dotted line) shows the trend is continuing. A Change of Character (CHOCH, solid line) signals a possible reversal.
Higher-timeframe levels are confirmed on candle close, so they never move after the fact.
Turn any timeframe or layer on or off. Your instrument, timeframe and layers are remembered next time.
Gold, EUR/USD, GBP/USD, USD/JPY, Bitcoin and Ethereum, on 5m to 4H charts, updating through the day.
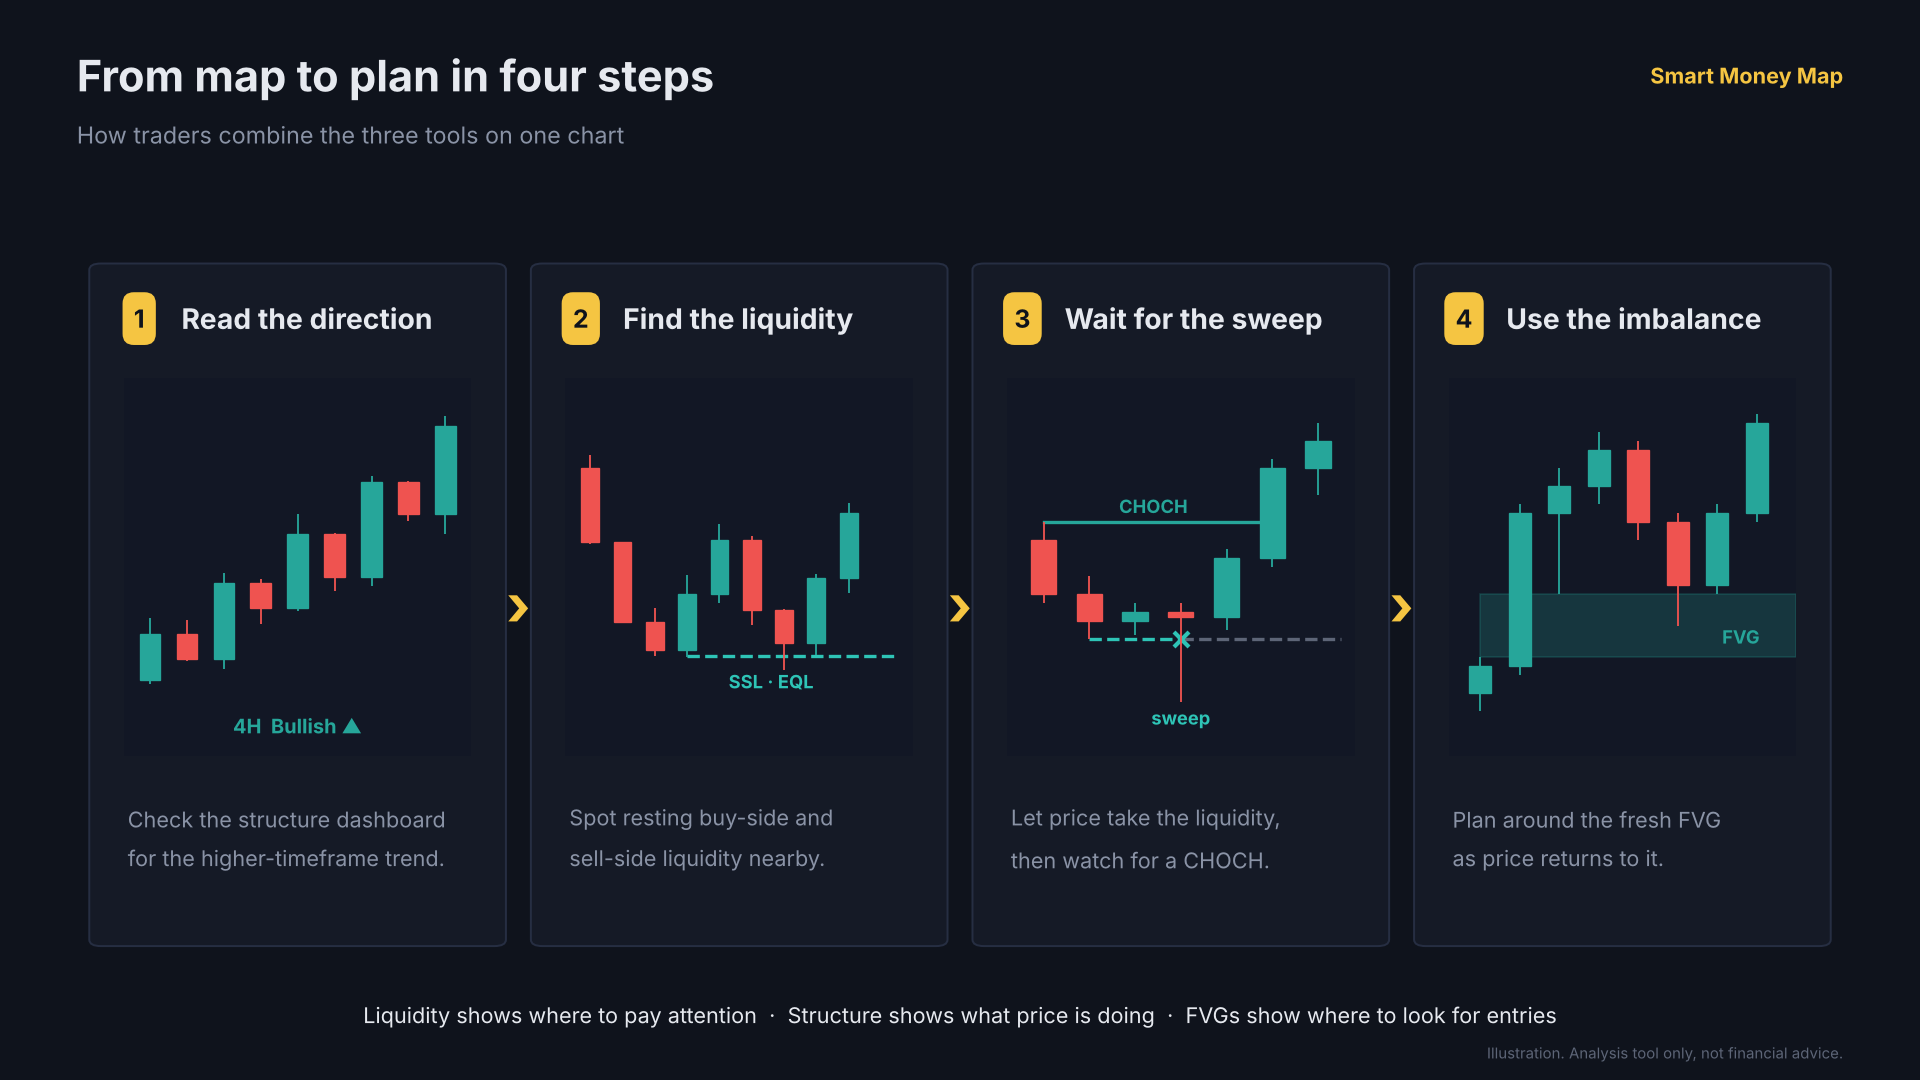
Liquidity shows where to pay attention. Structure shows what price is doing. FVGs show where to look for entries.
Smart Money Map is a monthly subscription for the chart software. It works with your free Tradex Bot account and is separate from Bot Pro, so you can have either one or both. Try it free for 3 days: your card is saved at checkout and first charged when the trial ends. Cancel before then and you pay nothing.
Payments are handled by Stripe. We never see or store your card details. Smart Money Map and the auto trader work on real-time market prices.
$39 / month
3 days free, then $39 / month charged automatically to the card you enter at checkout, unless you cancel before the trial ends. By starting a trial or subscribing you agree to the Terms of Service, including the free trial policy and refund policy.
Already have a Tradex Bot account? Log in, then come back here.
No. It shows where liquidity is resting, which imbalances are still open and what structure is doing, so you can build your own plan. It is an analysis tool, not a signal service or financial advice.
Stop orders tend to collect above highs and below lows, especially equal highs and equal lows. A sweep is when price runs through one of those levels and takes the orders resting there. The chart stops the level at the candle that took it, so you can see exactly where it happened.
A three-candle imbalance: price moved so quickly that the wicks of the first and third candles don't overlap. Traders watch these gaps because price often returns to them. The chart shows only gaps that are still open, and shrinks each one as it fills.
A Break of Structure (BOS) is a close beyond the last swing in the direction of the current trend, so the trend continues. A Change of Character (CHOCH) is the first close beyond a swing against the trend, an early sign it may be reversing. BOS is drawn dotted and CHOCH solid.
Switch the chart between 5m, 15m, 1H and 4H, and map 15m, 1H, 4H and Daily levels on top of it. It covers all six Tradex Bot instruments: XAUUSD, EURUSD, GBPUSD, USDJPY, BTCUSD and ETHUSD.
No. Higher-timeframe levels are only drawn once that candle has closed, so a level you see now will not move or disappear later because of the same candle.
New candles arrive every minute and the chart refreshes itself every 30 seconds while it is open. Session levels use UTC: previous day and week are UTC days and weeks, and the Asian range is 00:00 to 07:00 UTC.
Yes. The chart and its controls work on phones and tablets as well as desktop.
Yes, 3 days. You add your card at checkout, but nothing is charged until the trial ends. If you don't cancel by then, you are charged $39 and then monthly until you cancel. One free trial per person (free trial policy). Manual demo trading on Tradex Bot stays free.
No. Smart Money Map and Bot Pro are separate plans. You can subscribe to either one, or both.
Open the chart and choose Manage billing. You can cancel in one click, change your card and download invoices. After cancelling you keep access until the end of the period you paid for.